SOL Price Prediction: Analyzing Technical Signals and Market Sentiment for 2025

#SOL
- Technical Weakness: SOL is trading below its key 20-day moving average with a bearish MACD, indicating current momentum favors sellers and the asset is in a corrective phase.
- Critical Support Test: The price is approaching the lower Bollinger Band near $124.91, a level that will determine if the decline stabilizes or accelerates.
- Negative Fundamental Catalyst: News of ETF outflows and ecosystem shifts contributes to cautious market sentiment, reinforcing the technical selling pressure and suggesting a recovery may require time.
SOL Price Prediction
Technical Analysis: SOL Shows Signs of Consolidation Below Key Moving Average
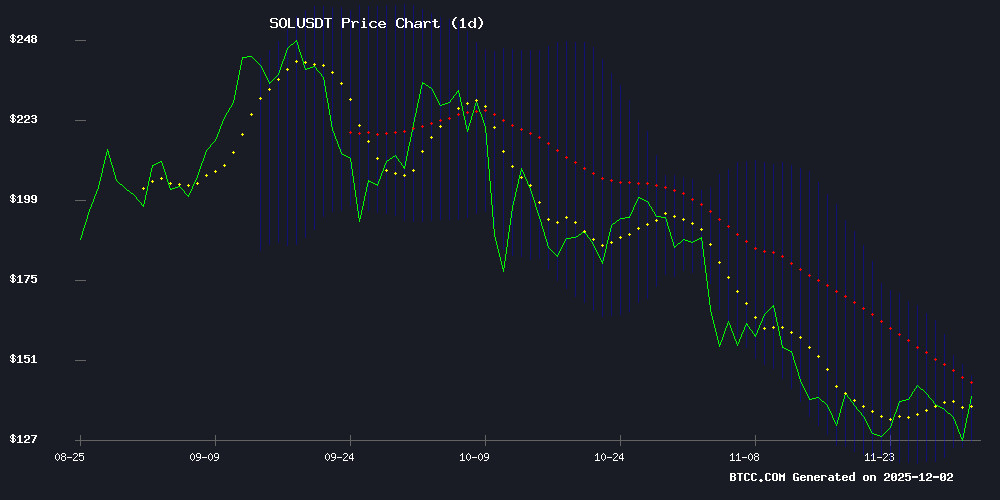
According to technical data analyzed by BTCC financial analyst Mia, SOL is currently trading at $126.93, which is notably below its 20-day moving average of $135.56. This positioning suggests the asset is in a short-term bearish phase relative to its recent trend. The MACD indicator, with a value of -4.97, confirms a bearish momentum crossover, indicating selling pressure has outweighed buying interest in the recent period.
The price is hovering NEAR the lower Bollinger Band at $124.91, which often acts as a potential support level. A sustained hold above this band could signal a stabilization, while a break below might lead to further declines. The distance between the current price and the middle band ($135.56) highlights the extent of the recent pullback. In summary, the technical picture points to a period of consolidation or testing of lower support levels before any significant bullish reversal can be confirmed.
Market Sentiment: Cautious Amid Structural Headlines
BTCC financial analyst Mia notes that recent headlines regarding Solana, including 'ETF Outflows and Token Economy Shifts,' point to a cautious market sentiment. News of ETF outflows typically suggests institutional or large-scale investors are reducing exposure, which can create near-term selling pressure. Simultaneous discussions about shifts in the token's underlying economy introduce uncertainty regarding future supply dynamics or utility, factors that can weigh on investor confidence.
This fundamental backdrop aligns with the current technical weakness, creating a environment where negative news FLOW reinforces the bearish price action. Investors are likely awaiting clearer signs of stability in both ETF flows and project development before committing new capital. The sentiment is one of watchful caution rather than outright panic, but it underscores the importance of monitoring these fundamental developments alongside price charts.
Factors Influencing SOL’s Price
Solana Faces Market Turbulence Amid ETF Outflows and Token Economy Shifts
Solana (SOL) entered the week under pressure as cryptocurrency markets faced broad sell-offs. The asset peaked at $140.19 last Sunday before plunging 10% to $126, mirroring weak market sentiment and liquidity constraints. Technical indicators suggest $121.66 as a critical support level, with a breach potentially triggering further declines.
Spot Solana ETFs recorded their first daily outflow after 21 consecutive days of inflows, amplifying downward momentum. Proposed changes to Solana's token economy added another layer of uncertainty, prompting investors to reassess long-term network dynamics. Resistance now looms near the $144-145 range, where supply concentration may cap rebounds.
Is SOL a good investment?
Based on the current technical and fundamental data, SOL presents a high-risk, high-potential investment scenario that requires careful timing and risk management.
Current Assessment: At its current price of $126.93, SOL is in a corrective phase, trading below its key 20-day moving average and showing bearish momentum on the MACD. The proximity to the lower Bollinger Band suggests it is testing a crucial support area. The negative news flow regarding ETF outflows adds fundamental headwinds. This combination makes it a less ideal candidate for immediate, aggressive investment for risk-averse investors.
Investment Perspective: For investors with a longer-term bullish outlook on Solana's technology and ecosystem, this pullback could represent a potential accumulation zone, but only if the $124.91 support level holds. A prudent strategy would be to wait for a confirmed reversal signal, such as a reclaim of the 20-day MA or a bullish MACD crossover, before entering a position. The current environment suggests it's a time for analysis and preparation rather than immediate action.
| Factor | Status | Implication for Investment |
|---|---|---|
| Price vs. 20-Day MA | Below ($126.93 vs. $135.56) | Short-term trend is bearish; wait for a break above. |
| MACD | Negative (-4.97) | Momentum is bearish; indicates ongoing selling pressure. |
| Bollinger Band Position | Near Lower Band ($124.91) | At a key support level; watch for a bounce or breakdown. |
| Market News/Sentiment | Negative (ETF Outflows) | Creates fundamental overhead pressure; limits upside in near term. |
| Overall Risk/Reward | High Risk / Potential Reward | Favorable only for patient investors who can tolerate volatility and are waiting for a confirmed trend change. |
